Controller Diagnostics out of the Cockpit
This topic contains the following sections:
- How to display diagnostic information in the Cockpit
- Available diagnostic information
- Notifications log
| Note
This topic only applies to the standard (non-safety-related) machine controller. The steps for the Safety PLC are described in the help chapter "Safety PLC Commissioning: From Compiling to Debugging ×‣ Connecting vs. Monitoring Mode vs. Debug Mode ×‣ Safety Cockpit: Controlling the Safety Application ×‣ Safety PLC Diagnostics out of the Safety Cockpit ×‣ Monitoring/Debugging the Safety PLC ×‣ Monitoring Mode: Displaying Online Values ×‣ Debugging Safety-Related Code: Forcing/Overwriting ×‣ WATCHES: Monitoring/Debugging the Safety-Related Application ×‣ Safety PLC Simulation ×". |
- Display of the essential diagnostic information on the controller.
- Main control functions to start, stop, and reset the controller. If supported by the controller, project sources can be read from the controller.
| Note
Poor internet connection? Performance problems due to VPN connection? You can adapt the TCP communication settings by increasing the handshake timeout value and the polling interval. See topic "TCP Communication Connection". |
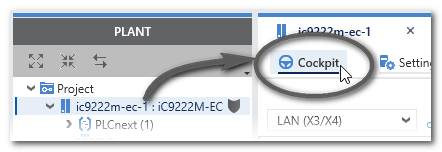
 How to open the controller 'Cockpit'
How to display diagnostic information in the Cockpit
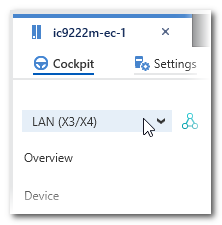
Proceed as follows to display the most important diagnostic information of the controller.- Make sure that the controller is set as target system and the controller port to which the LAN cable is connected is selected in the Cockpit.
- Click the 'Connect to controller' button on the 'Cockpit' toolbar to establish a communication connection between iCube Engineer and the controller. The 'Connect' command is also available in the context menu of the controller in the PLANT and in the ONLINE STATE window (Cross Function Area).

It is not necessary to be attached to the controller application (no debug mode required).
Available diagnostic information
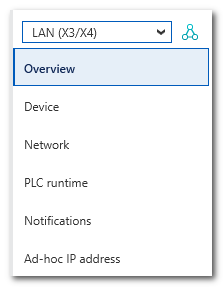
The information is divided into several sections which can be selected via the list on the left. The shown information depends on the controller type involved. Example:
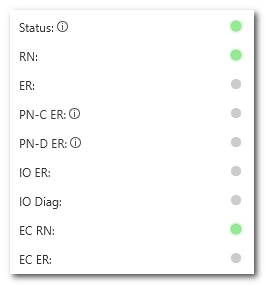
The LEDs on the 'Overview' page correspond to the LEDs on the controller device. Like the hardware LEDs, these virtual LEDs light up according to the device status.
| Further Info
For detailed information on the LED indicators of your controller, refer to the user manual of the device. |
Example for the iC9222M-EC controller type:
Furthermore, the page provides information on the name of the currently loaded/executed project. It also displays details on the controller's memory utilization and the CPU load (for each core).
The further pages give various information on the memory utilization, port settings, controller status and the firmware/hardware version.
Notifications log
Diagnostic messages sent from the iC9200 Series target (i.e., from firmware components) are loaded, logged and displayed in the 'Notification' category of the PLCnext Cockpit. Each entry shows a 'Severity' identified by a particular icon, the origin of the message ('Sender') and the name.
The NOTIFICATION LOGGER window in the cross function area also displays the notifications. The window provides the same information and operating options as provided in the cockpit's 'Notification' category. Additionally, the notifications can be filtered by various filter criteria or by text.
| Further Info
For a detailed description of possible messages refer to the controller manual. |
| Icon | Severity |
|---|---|
 | Internal |
 | Information |
 | Warning |
 | Error |
 | Critical error |
 | Fatal error |
While the iC9200 Series controller is connected, the list of notifications is updated each second. New notifications are appended at the end of the list. The total number of entries appears in the tooltip of the filter icon in the upper left corner of the list header.