Controller Commissioning: From Compiling to Debugging
|
WARNING
|
Unintended machine operation
|
| Note
Both the Safety PLC and the standard (non-safety-related) machine controller have their own, separate Cockpit and both can be connected and commissioned independently of each other. Therefore, both PLANT nodes provide separate context menu commands to write and start the standard project and the safety application independently. It is, for example, possible to write and start the standard application while simulating the safety-related application. See help chapter "Controlling the Safety Application from the Safety Cockpit". Safety download combined with standard download: However, it is possible to write and start the safety application together with the standard application. For that purpose, the commands 'Write and Start Project (incl. Safety)' (with and without project sources) are available. The following procedure also takes this case into account. |
- Verify the following:
- Controller and all configured devices are available in the network.
- Verify that the controller operating mode switch is in the desired position:

Only in switch position RN (RUN), the CPU can start the execution after completion of this procedure. If set to ST (STOP), execution is not started until switched to RN.
- Application structure modeled in the PLANT represents the physical network.
- IP address settings in the 'Settings' editor of each device involved are correct (controller node and PROFINET device nodes). If required, adjust the IP settings as described in the topic "Device Configuration/Parameterization".
- No errors are pending in the Error List (MESSAGES window).
- Programming mode is active and
debug mode is inactive, i.e., the controller node icon does not indicate a controller status and the controller name is not shown bold in the PLANT. Reason: the project cannot be written to the machine controller while online and debug data is exchanged in debug mode.
If on, switch the debug mode off by selecting 'Debug On/Off' from the context menu of the controller in the PLANT or in the ONLINE STATE window, or deactivate the corresponding icon on the 'Cockpit' toolbar:

Note
Poor internet connection? Performance problems due to VPN connection? You can adapt the TCP communication settings by increasing the handshake timeout value and the polling interval. See topic "TCP Communication Connection". - Set the controller (not the controller simulation) as target system.
- Double-click the controller node in the PLANT to open its properties in the editors area.
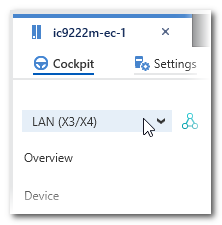
- In the editors area, open the 'Cockpit' editor.
- In the 'Cockpit' editor, select the controller port to which the LAN cable is connected.
Example for the iC9222M-EC controller:
Note
Ad-hoc IP address instead of project-defined address
Instead of the IP address defined in the controller settings of the project, you can also connect to a controller with any other IP address (provided it can be accessed in the network). In this way, communication connections to several PLCnext devices can be established one after the other (e.g. in router scenarios) without having to change the IP address in the project settings and rebuild the project. How to do this is described under "Ad-hoc IP address instead of project-defined address". - Create the project image (build the project), send it to the controller, and start the program execution.
The project image contains the application logic as machine-readable code and all relevant configuration/parameterization data of the project.
Building the project, sending, and starting the project execution is possible with only one command:Note
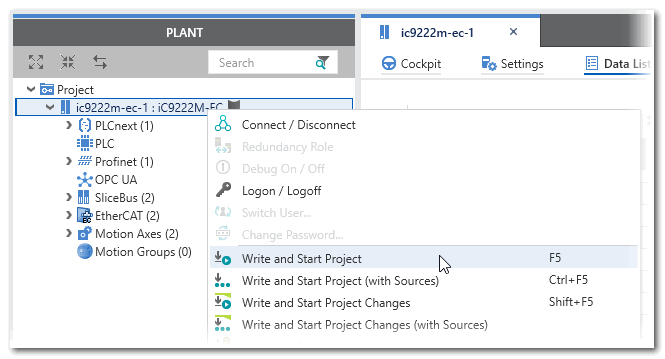
When writing the project to the controller and starting up the application, observe the safety warning message noted at the beginning of this topic.In the PLANT, right-click the controller node and select the desired 'Write and start project' from the context menu or press <F5> on your keyboard.
It is possible to combine the safety download with standard download. (See also the help section "Further 'Write and Start' commands..." below.)
Alternatively, select the command in the context menu of the machine controller in the ONLINE STATE window, or click the following icon on the 'Cockpit' toolbar:
Refer to the topic "Controlling the application / Toolbar icons in the Cockpit" for detailed information on the 'Write and Start' command.
 'Write and Start' aborted due to compiler errors?
Further 'Write and Start' commands...
'Write and Start' aborted due to compiler errors?
Further 'Write and Start' commands...
On the controller, the project is automatically stored as Boot Project in the Flash Memory. As a result, the controller will automatically execute this project after each start-up.Not yet logged on to the controller?
iCube Engineer automatically attaches to the process and switches to Debug mode when the project execution has been started after a 'Write and Start' command.
- Perform a function test after the successful controller startup. To support you in this, iCube Engineer provides the following features:
- Debug mode in which online values are read cyclically from the controller and displayed in the editors.
- Debug commands, such as forcing/overwriting of variables and breakpoints.
After activating an extended debug option in the Cockpit, debugging of functions, methods, inline transitions and actions is possible. This option, however, increases the execution time and memory consumption on the controller. - For SFC worksheets, additional SFC-specific debug commands are available.
- WATCHES window for collecting variables from different worksheets, displaying their online values and execute debug commands.
- LOGIC ANALYZER for recording and graphical representation (as curves) of variables values read from the running controller.
If you detect incorrect behavior or an error in the application logic during the function test, you must make certain that it will not lead to a hazardous situation. Observe the safety warning message noted at the beginning of this topic. Next, remove the error in the application logic by reediting the project. Following a successful compilation, start commissioning again.Note
The test of the application in debug mode using debug commands, the WATCHES window and LOGIC ANALYZER may not replace the proper function test using I/O devices/sensors/actuators under any circumstances. The test in debug mode may only be performed in addition to the standard function test, as a preliminary test, for example.Safety download combined with standard download:
If you have included the safety project image by selecting one of the commands 'Write and Start Project (incl. Safety)' (with and without project sources), you must additionally perform a safety-related function test. With a few exceptions, the same debug and monitoring tools are available for the safety application as for the standard application. Refer to the corresponding help topic in the chapter "Safety PLC Commissioning: From Compiling to Debugging".